Gold
—
per ounce
Silver
—
per ounce
Copper
—
per pound
Right now. Gold and silver are spot, per ounce. Copper is the COMEX future, per pound. The charts below stay on a fixed early-October snapshot.
The Mispriced Asset
Gold is over $4,000.Silver is <$20 past its 1980 high.
Silver does more real work than gold. The price still treats silver as cheap. One ounce of gold costs about 69 ounces of silver.
In January 1980, gold was about $850 and silver was $50. The pale part of each bar is that old high. The color is the rise since.
Gold
$4,173
$3,323 above the January 1980 high of $850. 4.9× that spike.
Silver
$61
$11 above the January 1980 high of $50. 1.2× that spike.
Gold got a new price. Silver did not.
This line is how many ounces of silver buy one ounce of gold. High means silver is cheap. It is still about 69. The gold thread at 16 is the old coin rule, from when people treated them as money together. The red line is 2022, when AI went public and silver was already in short supply.
- Price gap
- 69
- Factory use
- 58%
- Shortage
- 6 yrs
- New mine
- ~12 yrs
Ounces of silver it takes to buy one ounce of gold. That is a cheap silver price.
Of silver goes to factories. Only about 7% of gold does.
The world has used more silver than mines made.
A new silver mine takes about 12 years. A new product takes months.
01/The price gap
Gold’s price ran. Silver’s did not.
Since 1970, gold’s price is up about 116 times. Silver’s is up about 34 times. Silver is the metal factories use. Gold is the metal people store. The price has it backwards.
01
Since 1970, gold’s price left silver behind.
Both lines start at the 1970 price. The scale is how many times that price, not dollars. Gold is now about 116 times its old price. Silver is about 34 times. Silver rose. It is still far behind gold.
- Gold
- Silver
01.1
Same house. Gold made it cheap. Silver did not.
This is one ordinary U.S. house, priced in ounces of metal. In 1970 it took 639 ounces of gold. Now it takes 101, because gold’s price rose. The same house still takes 6,885 ounces of silver. That is more than twice the 2,965 ounces it took in 1980. Gold caught up to the house. Silver did not.
1970 639 oz · now 101 oz
1970 12,994 oz · now 6,885 oz
A normal U.S. home price, divided by that year’s average metal price. Not adjusted for inflation. The 2026 house is a rounded $420,000, not a finished sales year. The red line is 2022.
02/The real job
Silver works. Gold mostly sits.
About 58% of silver goes to factories. About 7% of gold does. Gold is mostly jewelry and savings. Silver is used in solar panels, electronics, and cars, and then it is gone. The working metal is the cheap one.
02.1
Factories use silver. They barely use gold.
Each pair of bars is one year. The tall bar is the share of silver that factories use. The short bar is the share of gold they use. Silver does the work. Gold keeps the high price.
- Silver, industrial
- Gold, industrial
02.2
Most new silver is used up, not stored.
Electronics and solar take a huge share. Coins and bars are not the main use. Old photo film used to need a lot of silver. That use died. The electrical uses did not.
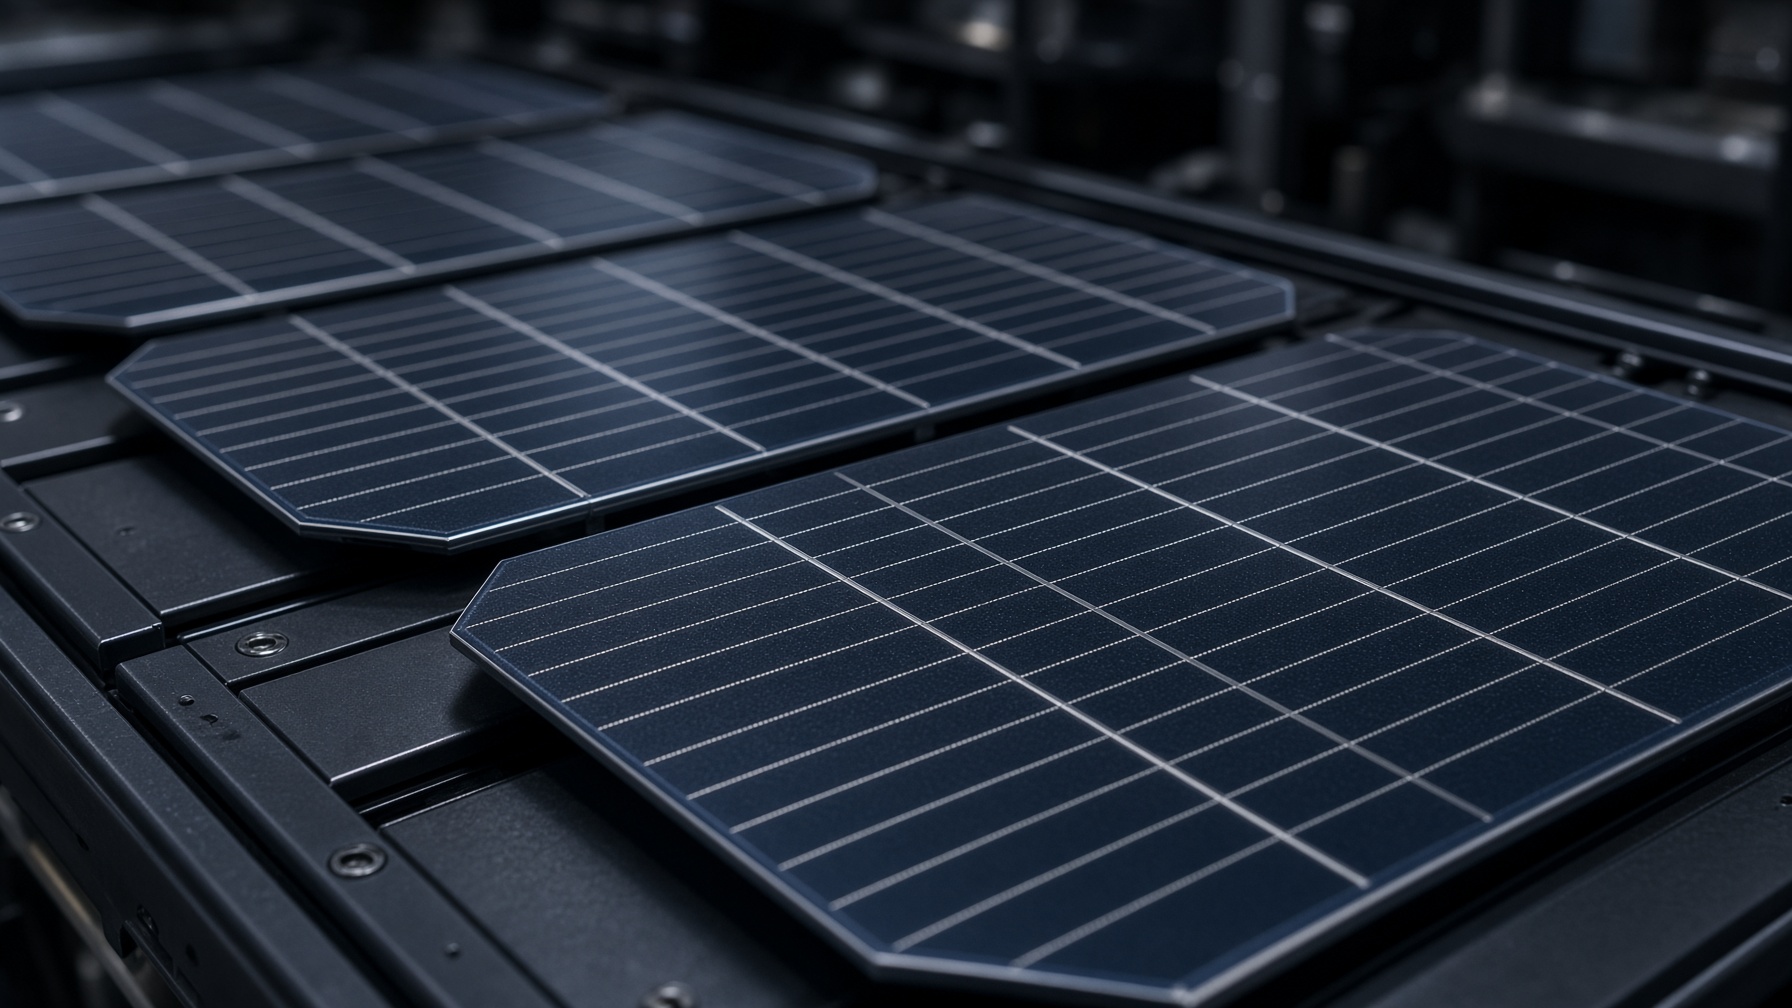
03/Where it goes
Silver is the best metal for the job.
Silver carries electricity and heat better than any other metal. Factories try to use less, because it costs money. They still need it where a failure is expensive: solar cells, car power parts, and data centers. AI adds more of those parts, and it adds them faster.
03.1
Silver conducts better than copper. Gold is not the wire.
100 is copper. Silver is higher. Gold is used in electronics because it does not tarnish, not because it carries current best. When a part has to move power and heat, the metal is silver.
03.2
Solar panels use less silver each. The world builds more panels.
The bars are silver used in solar panels. The line is how many panels got built, starting at 100 in 2015. Building soared. Silver per panel fell, because silver became a big part of the cost. Using less is already in the numbers. It does not mean solar stopped needing silver.
- PV silver, Moz
- Solar build index
03.3
An electric car uses more silver than a gas car.
A gas car uses about 15–28 grams. An electric car uses about 25–50. One car is not a crisis. The pile is: the car, the charger, the power hardware, and the data center on the same grid. Those parts use silver because cheaper solder fails in the heat.
04/The mines
A higher price does not make more silver next year.
About 7 in 10 ounces of mined silver come out of copper, lead, zinc, or gold mines. Those mines do not dig faster because a new chip needs more silver. A new silver mine takes about a decade. For six years the world has used more than mines produced. That silver came out of stockpiles. Stockpiles run out.
04.1
Factories wanted more. Mines did not deliver.
The gold line is what mines produced. The silver line is what factories used. Factory use climbed to a record 680 million ounces in 2024. Mine supply stayed in the same range. A higher silver price does not open a new mine this year.
- Mine supply
- Industrial demand
04.2
Six years of using more than we mined.
Each red bar is one year’s shortage. The line adds them up. The hole got smaller after 2022. It did not turn into extra metal. Since 2021 the shortages add up to about 764 million ounces. That is close to eleven months of mine supply.
- Annual deficit
- Cumulative
04.3
Most silver is a leftover from other mines.
A silver price spike does not grow silver the way a wheat price grows wheat. Most of it shows up because someone was mining copper. Recycling helps. It does not let you turn the supply up this quarter.
Other mines 72%
Silver mines 28%
The shortage on the chart above is 764 million ounces. This bar is why a higher price does not quickly dig up more.
04.4
A new product takes months. A new mine takes about 12 years.
These are rough clocks, not a schedule. A new silver mine is a long permit. A new device that needs silver is designed in a product cycle. A new AI model is faster than both. Demand can jump. Supply cannot.
05/The speed
AI asks for silver faster than mines can answer.
Each new electrical age arrived faster than the one before it. AI is the fastest one yet, and it sits on top of cars, solar, and the grid. It does not replace them. It adds more parts that have to conduct power. Factories will invent uses we do not have names for yet. Those uses show up in months. The mine is still waiting on a permit.
05.1
New technology shows up faster each time.
How many years from a working demo to something the world actually uses. The bars get shorter. Silver lives in the parts that have to conduct while that happens. Faster inventions mean more new parts, sooner, before factories can learn to use less silver in the last one.
05.2
Using less silver does not cancel the next use.
Three sketches, not a forecast. Mines barely grow. “Less per part” means known uses creep up slowly, because factories use less silver as volumes rise. “More electric” means solar, cars, and grid gear grow faster. “AI speed” means new uses arrive faster than factories can cut silver out of the old ones. A flat mine cannot match that.
- AI speed
- More electric
- Less per part
- Mine supply
Where the silver goes
We already use it
- Solar panel lines
- Electrical contacts and switches
- Solder and brazing
- Chemical plants
- What is left of photo film
Already arriving
- Silver joints in power parts
- Electric-car chargers and inverters
- Data-center power and connectors
- Sensors in robots and cars
- Denser chip packages
Not named yet
- The next part a lab writes down
- New connections, before anyone saves silver on them
- Printed circuits at large scale
- Whatever the next hot chip needs
- Uses that are not on this list
On the fast sketch, factories alone would need about 1106 million ounces by 2035. Mines would still be near 908. Today’s whole market, jewelry included, is already about 1,130. Silver was priced like jewelry and pocket change. It is the metal in the power parts. AI does not only want smarter software. It wants power, connections, sensors, and machines. Those need industrial metals, and they need them faster than the last cycle did.
06/The catch-up
What silver would cost if the price caught up.
Leave gold where it is. Change only how many ounces of silver buy one ounce of gold. Today it takes about 69. In 2011 it took about 45, before AI. The old coin rule was 16. None of these is a promise. They show how cheap 69 still is for a metal factories cannot skip.
Ounces of silver per ounce of gold
69
Silver’s price if it catches up
$60
-1% versus today’s $61
This is today. Silver has risen, and it is still cheap next to gold.
Move the slider. Gold stays at today’s price. The big number is what one ounce of silver would cost if it caught up. It is not a promise. Factories need silver either way.
Gold gets the price. Silver does the work.
Silver is used more, and it is still cheap next to gold. Factories already need it. AI will need it for more things, sooner. Mines cannot speed up to match.
How this page gets paid
The charts are free. A silver purchase can pay the page.
These shops sell real bars and coins. This site does not sell metal and does not hold your money. If a link has a partner code, the shop may pay this page a commission. You pay the shop’s price either way.
Sources
Where the numbers come from.
Live gold and silver
Spot quotes in dollars per troy ounce. They move. They are not the snapshot used in the charts.
gold-api.comLive copper
COMEX front-month copper, in dollars per pound, not per ounce.
finance.yahoo.com/quote/HG=F/Yearly gold and silver prices
Rounded London and COMEX annual averages through 2024. The 2026 point on the charts is an early-October snapshot, not the live tick.
www.lbma.org.uk/prices-and-data/precious-metal-pricesSilver supply and factory use
Rounded Silver Institute and Metals Focus figures: industrial demand, solar, mine supply, and the yearly shortage.
www.silverinstitute.org/Gold’s factory share
Rounded from World Gold Council demand data. Gold’s industrial share stays near 7–10%.
www.gold.org/goldhub/dataU.S. house prices
Median price of an existing home. Early years from HUD’s historical tables (NAR). 2026 is a rounded $420,000 stand-in, not a finished sales year.
www.huduser.gov/portal/ushmc/home.htmlSketches, not a dataset
Conductivity, grams in a car, mine clocks, how fast new technology spreads, and the three paths to 2035 are rough drawings. Each chart says so.